New App · Ages 7–11 · iPad & Android Tablets

Math They Can See Before They Memorize.

Visnos Math uses Bar Models and Function Machines to show kids why 6 × 7 = 42 — not just drill it. Understanding first, fluency second.

Build True Fluency — Free on iPad & Android

1× & 2× tables free · Full unlock $4.99 / £4.99 one-time

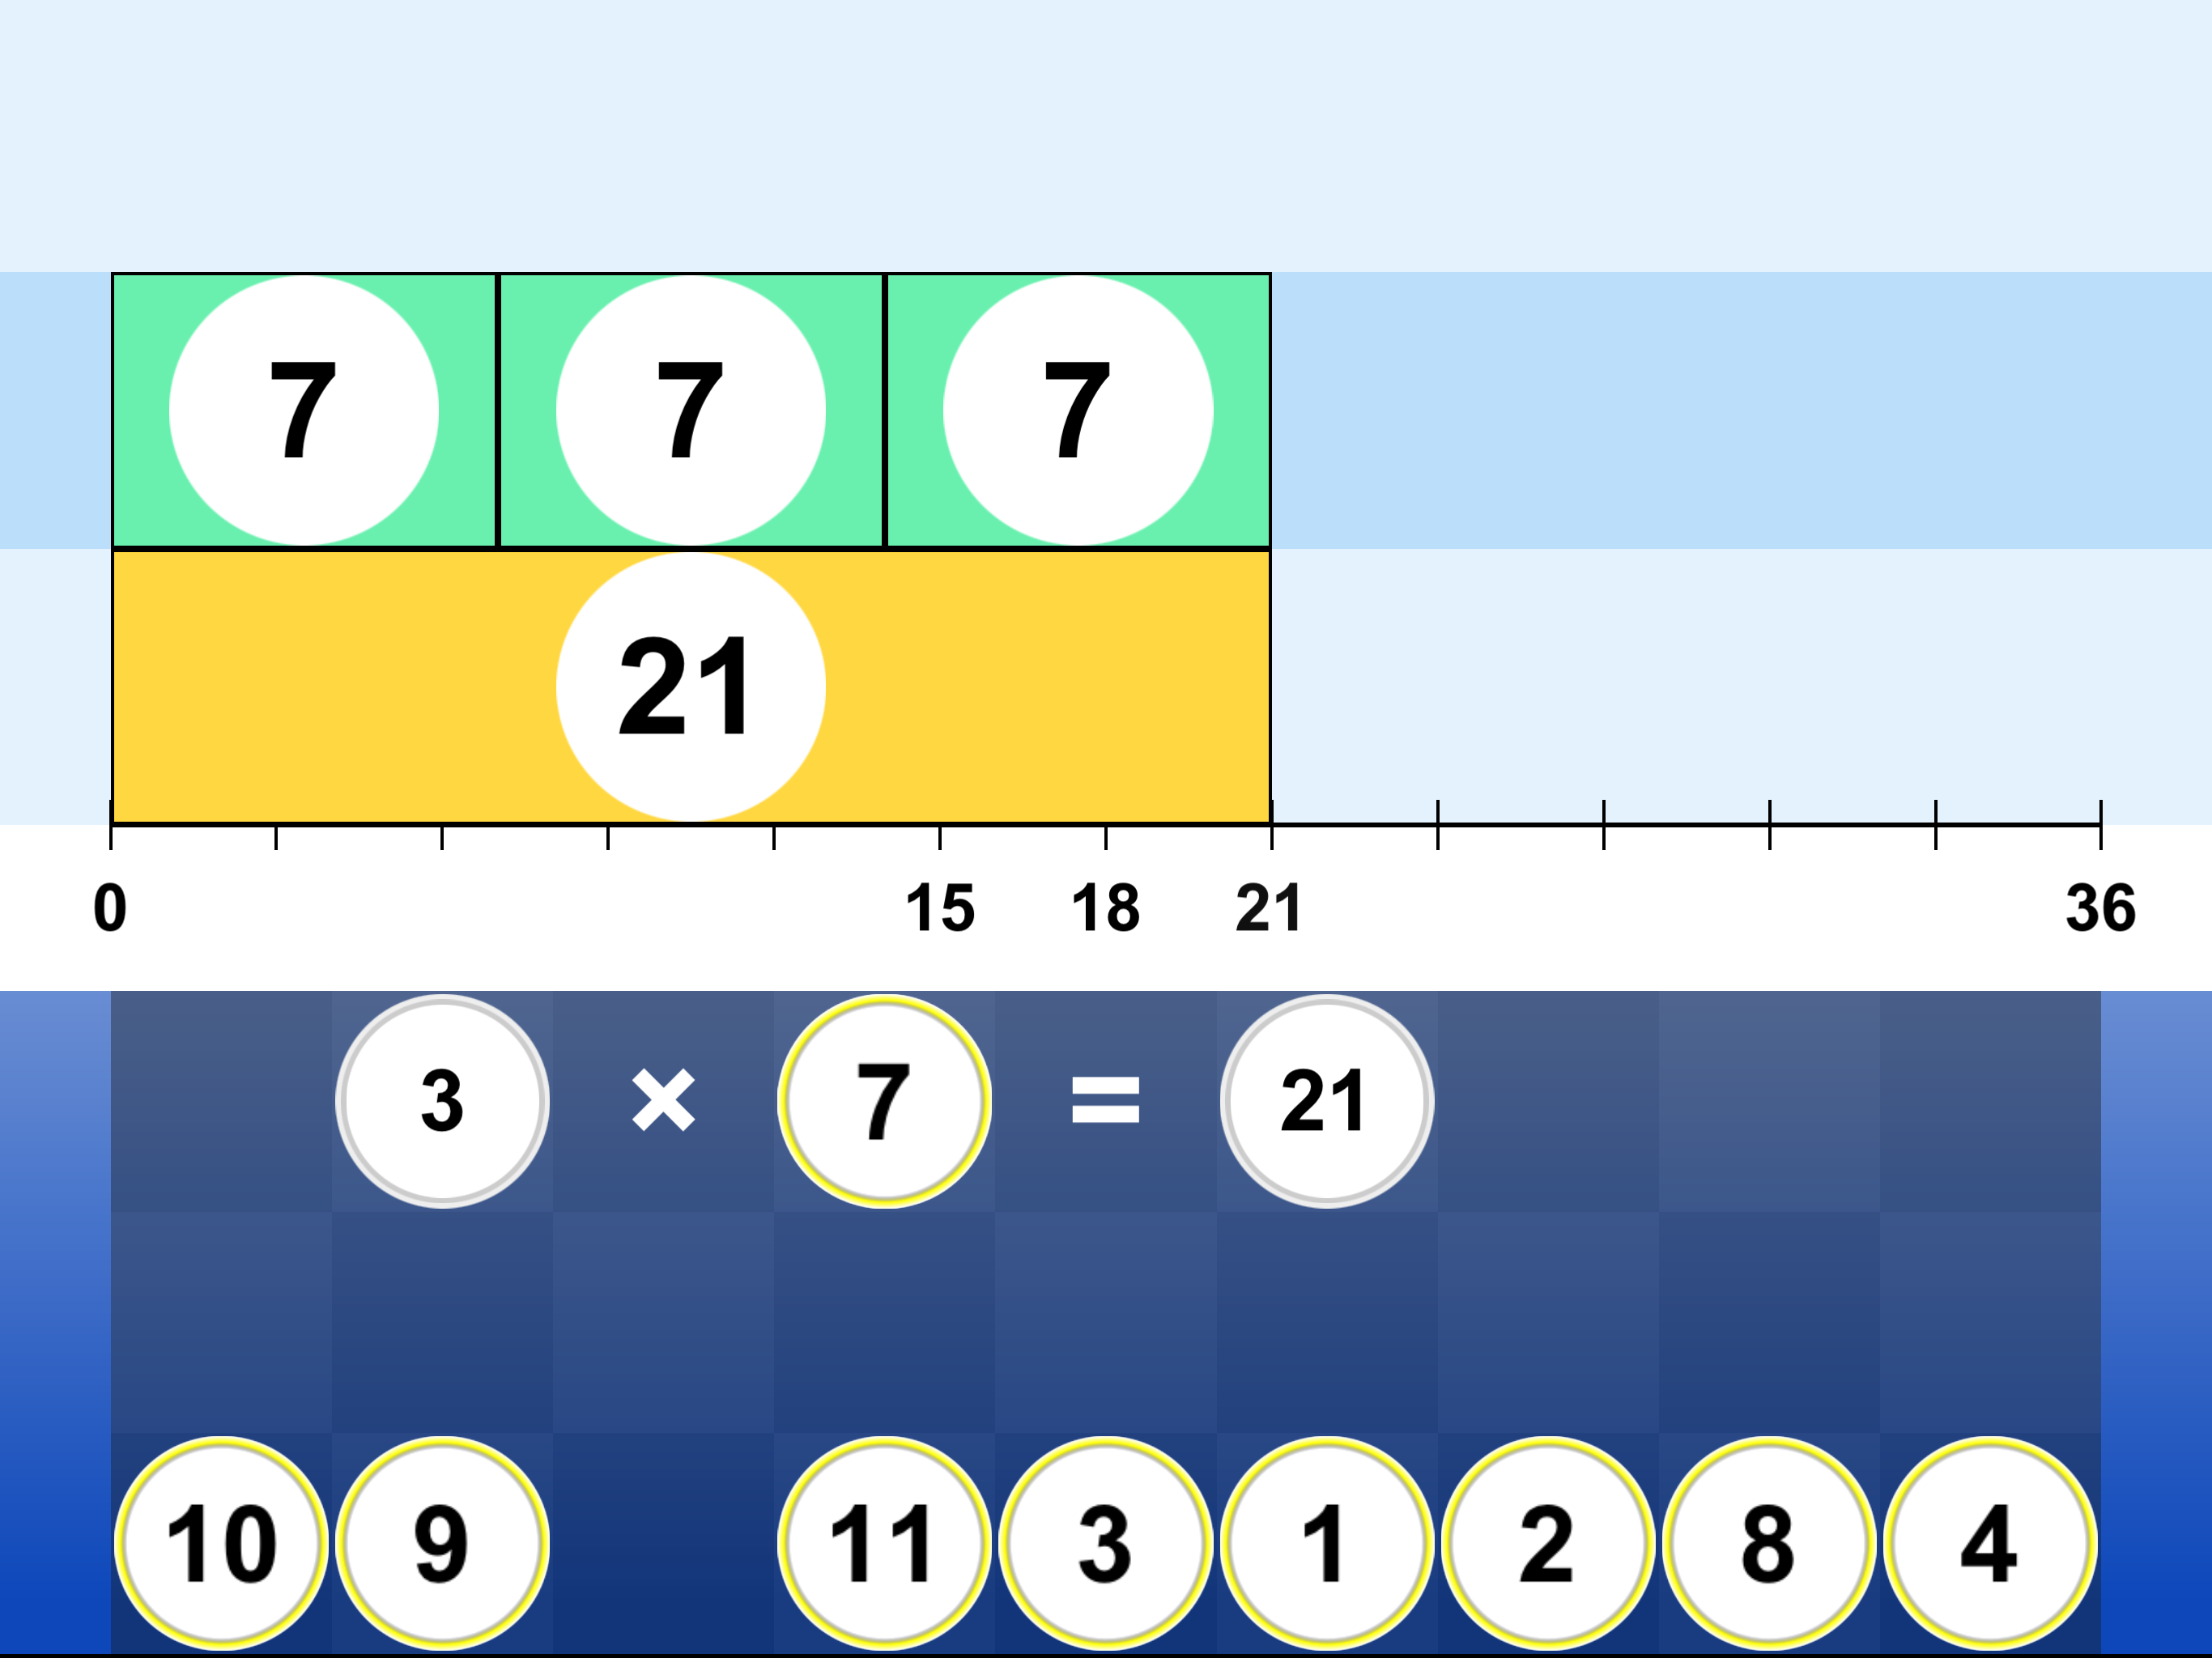
Visnos Math: Bar Model showing 3 groups of 7 equal 21
Bar Models build the multiplication concept.
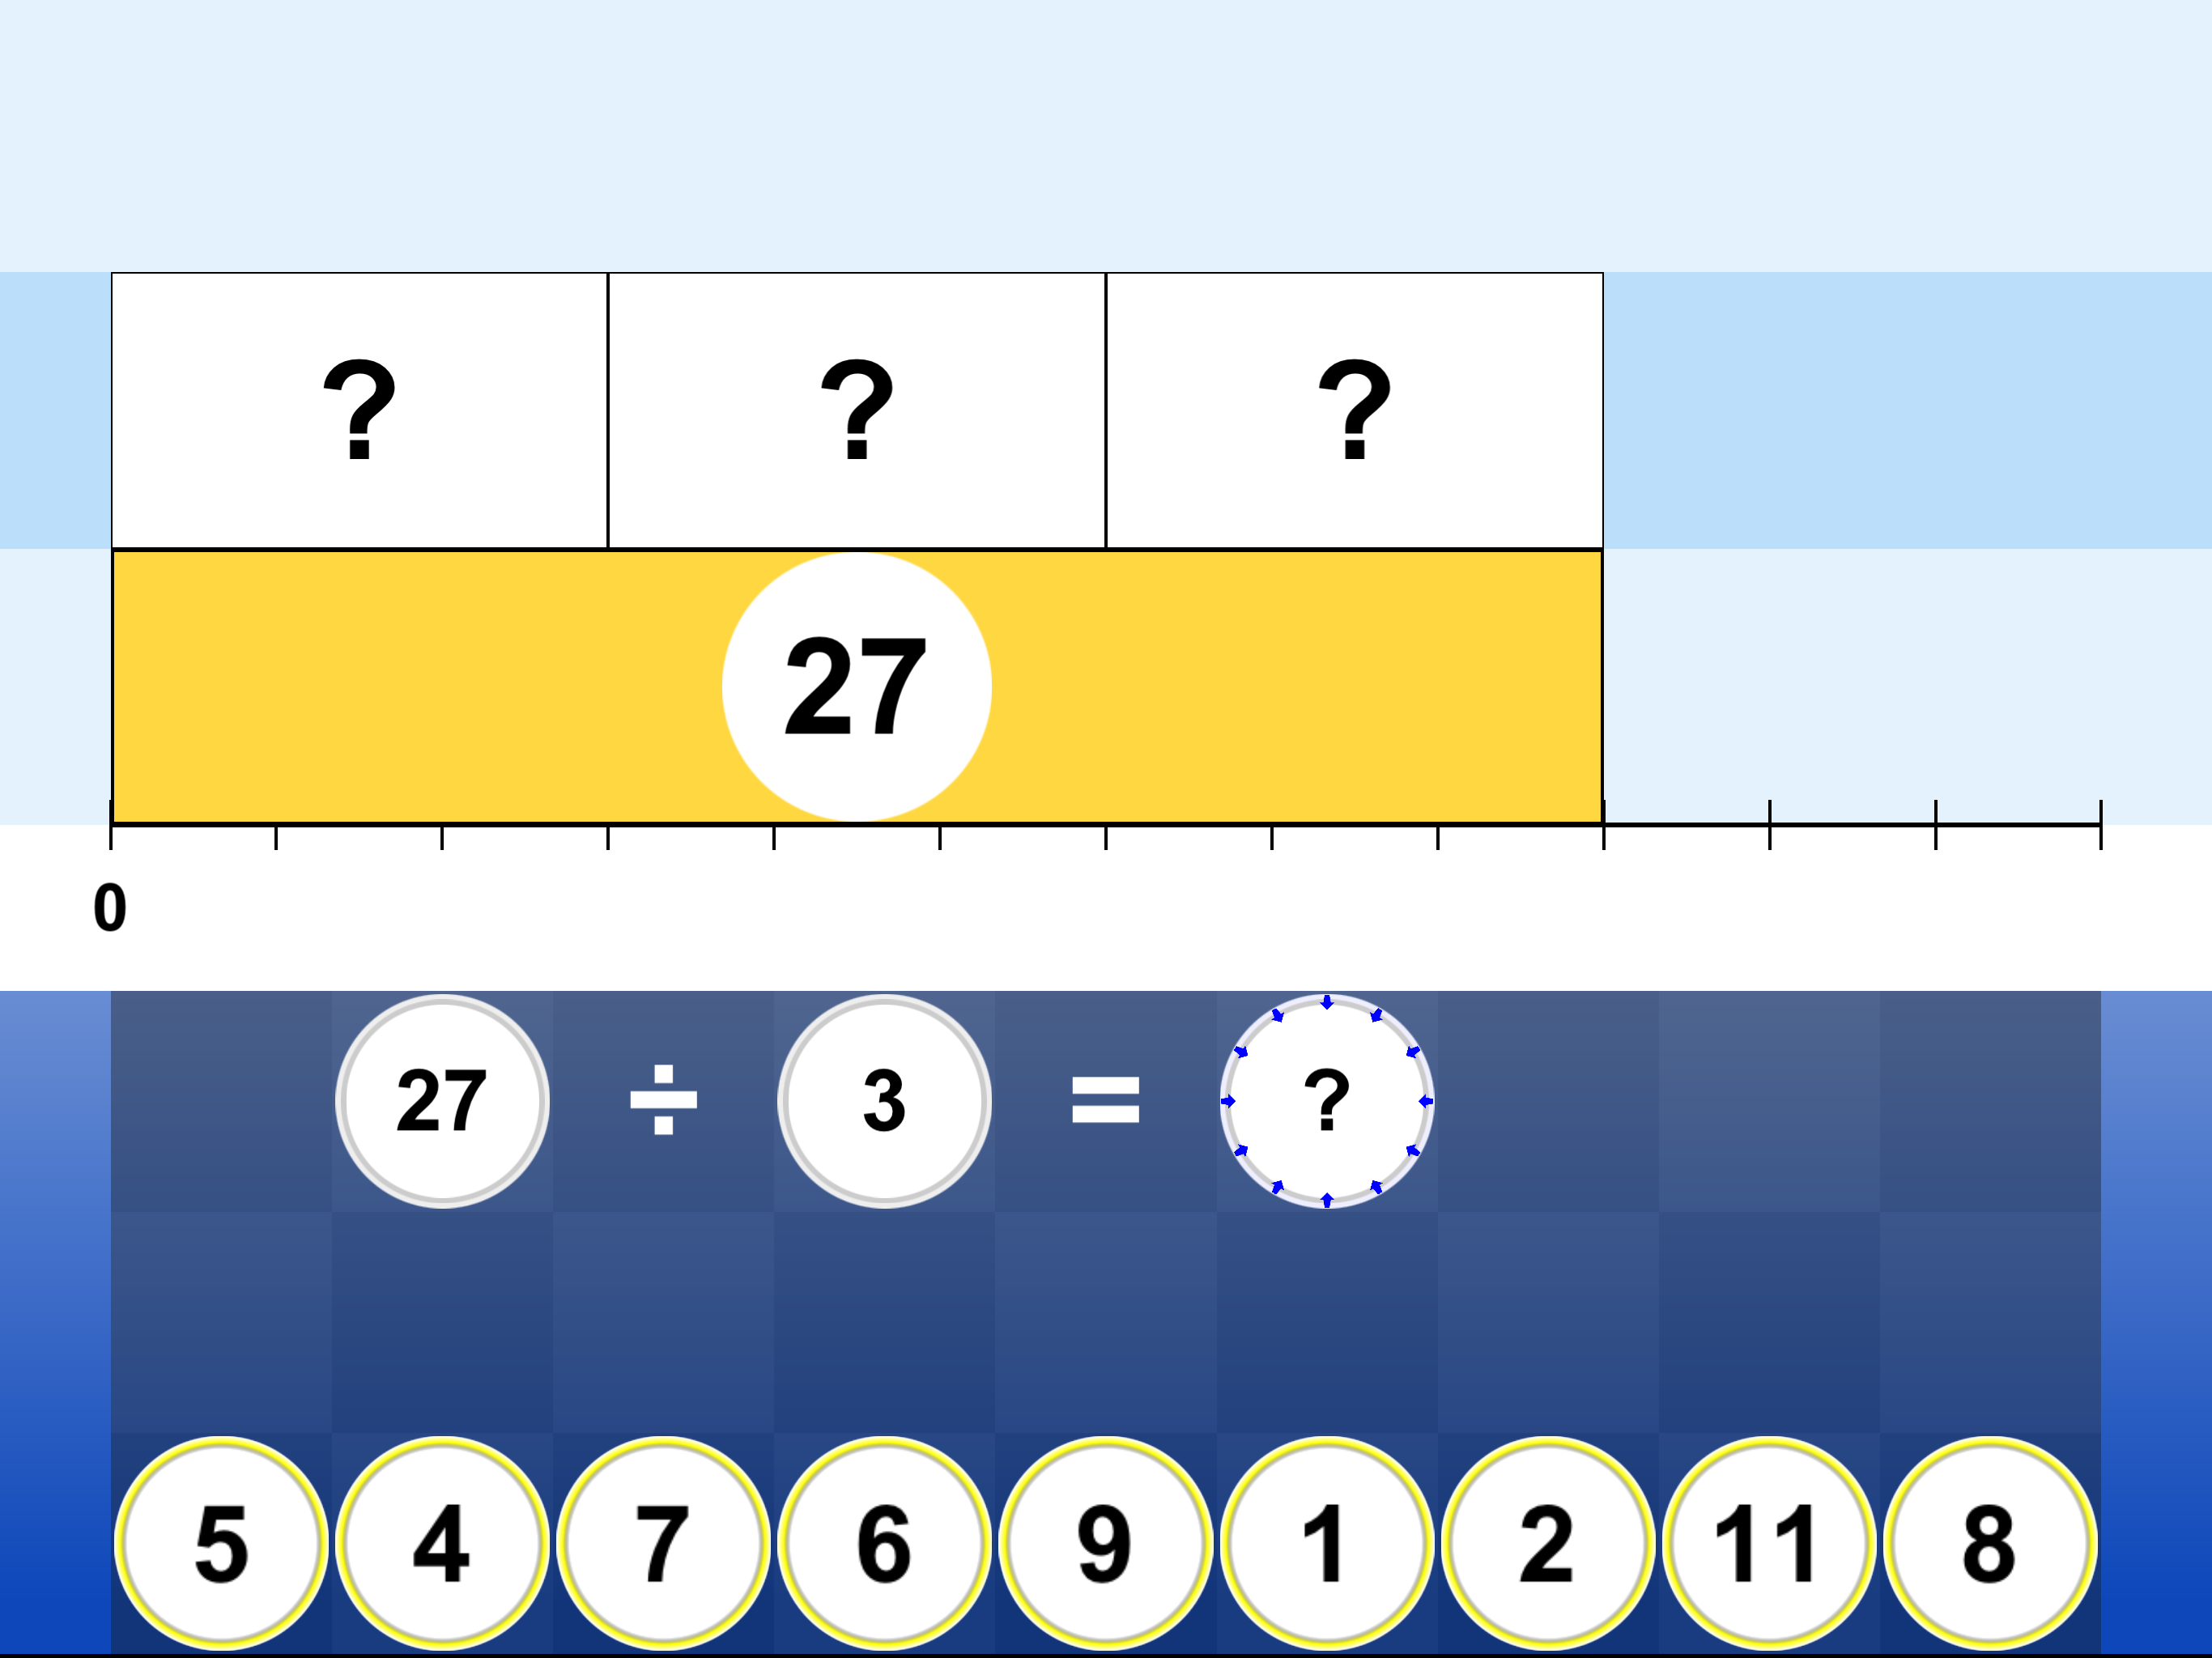
Visnos Math: Bar Model showing 27 split into 3 equal groups
…and reveal the inverse: division.

Visnos Math · Times Tables Mastery

Tune It. Race It. Master Times Tables.

Mac the Mechanic helps your child tune up the car with practice — then it's lights out on the grid. Speed drills your kid will actually ask to do.

Start Your Engines — Download Free
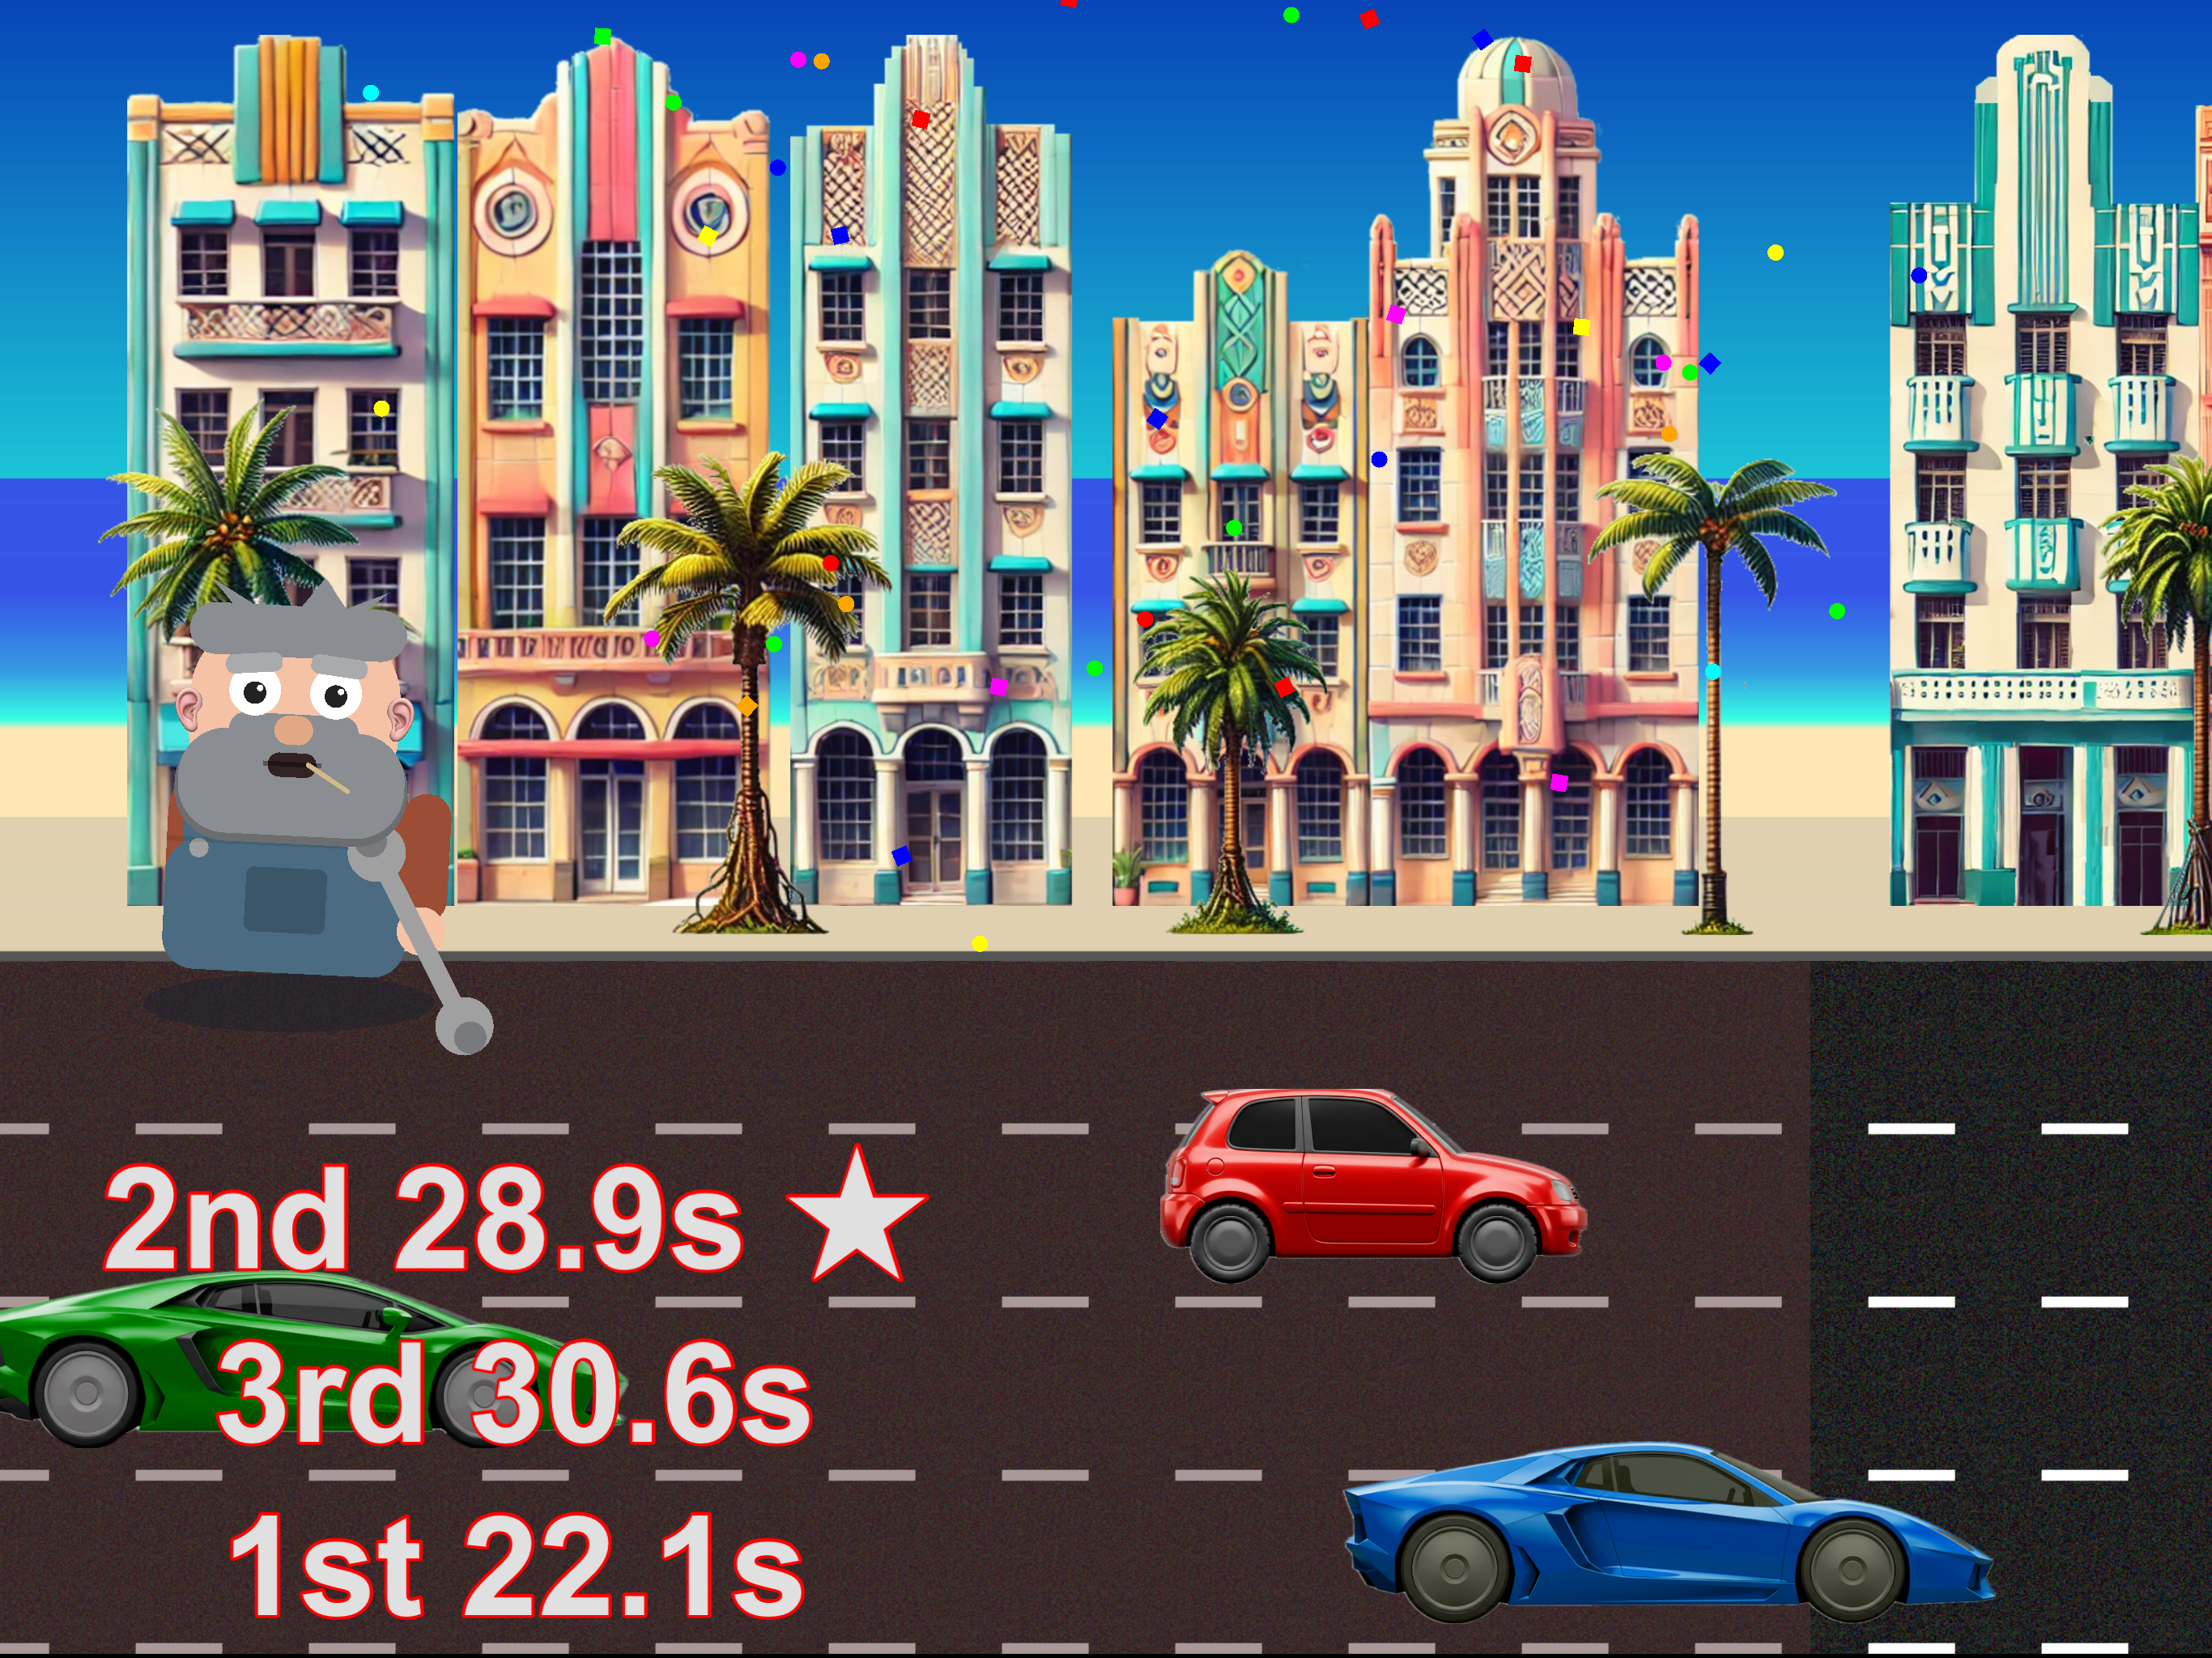
Visnos Math race-mode results screen with Mac the Mechanic and lap times
Race mode unlocks after every quiz — every fact mastered earns lap time.

Mathematical Demonstrations

Welcome to our interactive mathematics teaching resources. Below, you'll find the current set of activities, each with a brief description. Click a 'Launch' button to start one.

Once an activity is launched, you can access further information by clicking the 'info' icon, typically located in the top menu bar. Many activities also feature video instructions; click the video icon (if available) to watch them.

New activities and improvements are made regularly, so please remember to check back for updates!
📱 🎮

Coming Soon: Visual Times Tables

Master Times Tables. Don't Just Memorise.

Be the first to know when we launch our Mastery Mathematics App —featuring bar models, function machines, and the 1-12 Number Worlds.

Launching this summer on iPad & Android.

One email at launch. No marketing list.

We store your email in Google Cloud Firestore to email you once at launch. To be removed, email admin@visnos.com. Privacy Policy.

A clock screenshot
A clock

Time, Angles & Fractions

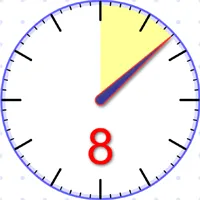
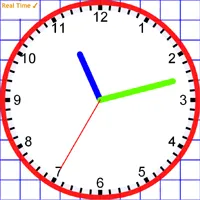
Display the current time in both analogue and digital formats, or take control by dragging the clock hands to show a specific time.

Extend the learning beyond time-telling. Use the clock face to demonstrate angles, visualize fractions, and represent percentages in a clear, interactive way.

factors of 12 screenshot
factors of 12

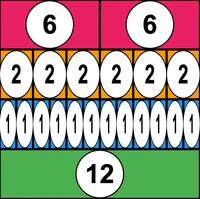
Bar Models (Whole)

Build bar models on a number line. Use manual mode to build models by hand, or the automatic modes to find the LCM, factors or addition facts of a number. Bars can be created with different lengths, cut up, joined and cloned.

The number line can be manually panned and zoomed, or set to autoscale.

modelling addition screenshot
modelling addition

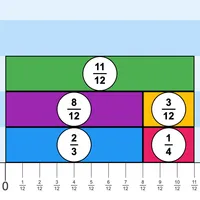
Bar Models (Fractions) New!

Build bar models from fractions on a number line. Set the base fraction, then pull out or add bars measured in halves, thirds, fifths — any denominator. Bars can be cut at their fraction marks, joined together (adding the fractions exactly), and cloned.

Switch between improper fractions and mixed numbers, and pan or zoom the number line to compare bars of different denominators.

a² + b² = c² screenshot
a² + b² = c²

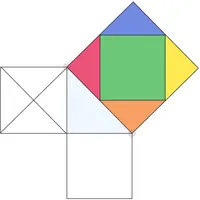
Pythagoras' Theorem

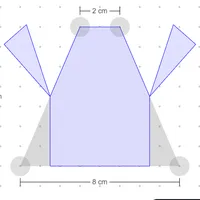
Explore Pythagoras' theorem for a right-angled triangle: the square on the hypotenuse equals the sum of the squares on the other two sides, a² + b² = c². Drag the vertices to change the triangle.

Watch a translation-only dissection proof, explore the Pythagorean tiling, then switch to problem mode to find a missing side step-by-step.

Plotting quadrilaterals screenshot
Plotting quadrilaterals

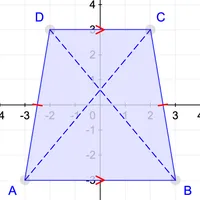
Quadrilaterals on a Coordinate Grid

Explore the coordinate grid by dragging vertices to form quadrilaterals. Practice plotting coordinates and identifying special quadrilaterals.

Test your skills with the missing vertex challenge by deducing the correct coordinates to complete a target shape.

Midpoint of a segment screenshot
Midpoint of a segment

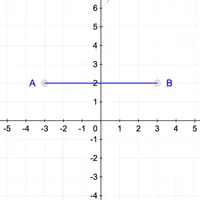
Midpoint of a Line Segment New!

Find the midpoint of a line segment on a coordinate grid. Drag the endpoints or generate a new problem, then reveal the coordinates to check your working.

Switch task to work backwards: given one endpoint and the midpoint, find the missing endpoint.

y = mx + c explorer screenshot
y = mx + c explorer

Equation of a Straight Line New!

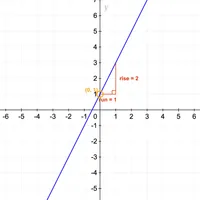
Explore how a straight line's equation shapes its graph. Drag the gradient and y-intercept sliders and watch the line respond instantly.

Reveal the equation at any point, or generate a random line to test your understanding of y = mx + c.

Equation from two points screenshot
Equation from two points

Equation of a Line Through Two Points New!

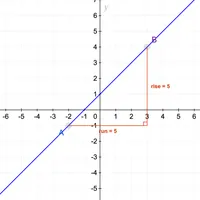
Find the equation of the straight line through two points on a coordinate grid. Drag points A and B, then reveal the gradient, y-intercept and equation to check your working.

Show the rise-over-run triangle, or switch to the Calculate tab to watch the derivation drawn step by step.

Probability spinners screenshot
Probability spinners

Probability Spinners New!

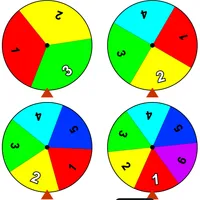
Explore probability with spinning wheels. Use fair spinners to generate random numbers, or bias a single spinner by dragging its sector boundaries to change the chances of each outcome.

Collect results as a hand-drawn tally chart, total the frequencies, then work out each experimental probability step by step and compare it with the theoretical value.

Angles on a straight line screenshot
Angles on a straight line

Measure Angles

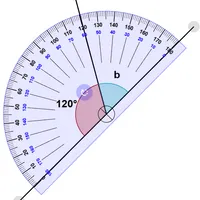
Practice estimating and classifying angles, including acute, obtuse and reflex. Explore problems involving angles in a right-angle (90°), on a straight line (180°), and at intersecting lines.

Drag the handles or use the random button to create a problem. Toggle the protractor to measure manually.

Angles at a point screenshot
Angles at a point

Angle Rules

Explore fundamental angle rules, including complementary (90°), angles on a straight line (180°), angles at a point (360°), and vertically opposite angles.

Drag the interactive markers to see the relationships in real-time, or generate random problems and click the unknown letters to reveal their values and test your understanding.

Angle at the centre screenshot
Angle at the centre

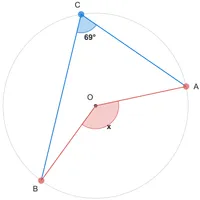
Circle Theorem: Angle at the Centre New!

Discover why the angle at the centre of a circle is always twice the angle at the circumference standing on the same arc.

Drag the three points around the circumference and watch both angles update together, or generate new positions to test the rule again.

Angle in a semicircle screenshot
Angle in a semicircle

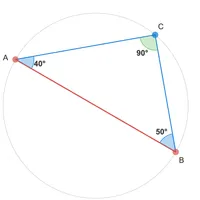
Circle Theorem: Angle in a Semicircle New!

See why the angle standing on a diameter is always a right angle, wherever the point sits on the circumference.

Then use it: with 90° at P, the other two angles of the triangle must add to 90°, so work out the one marked x and reveal the answer to check.

Angles in the same segment screenshot
Angles in the same segment

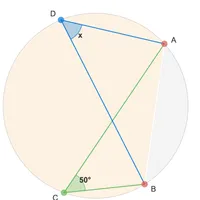
Circle Theorem: Angles in the Same Segment New!

Two points on the same arc, both looking back at the same chord — and the angles they make are always equal.

Slide either point along its arc and watch the angle refuse to change, then solve the problems: one angle is given, the other is marked x.

Cyclic quadrilateral screenshot
Cyclic quadrilateral

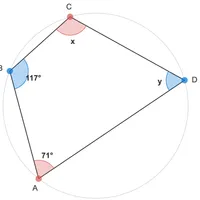
Circle Theorem: Opposite Angles in a Cyclic Quadrilateral New!

Put all four corners of a quadrilateral on a circle and something fixed happens: each pair of opposite angles adds to 180°.

Drag any vertex and watch both pairs hold. Then solve the problems — one angle is marked x, and part of the work is spotting which of the other three is opposite it.

Perpendicular to a chord screenshot
Perpendicular to a chord

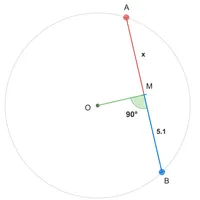
Circle Theorem: The Perpendicular from the Centre Bisects a Chord New!

Drop a perpendicular from the centre of a circle onto a chord and it always lands on the exact midpoint, however the chord is placed.

Drag either end and watch the two halves stay equal, then solve the problems: one half is given and the other is marked x.

Tangent and radius screenshot
Tangent and radius

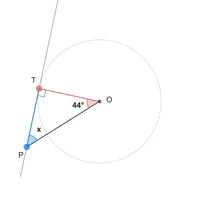
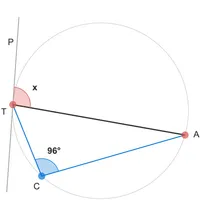
Circle Theorem: The Angle Between a Tangent and a Radius New!

A tangent touches a circle at one point, and the radius drawn to that point always meets it at a right angle.

Slide the point of contact round the circle or move P along the tangent — the 90° never budges. Then use it: the other two angles of the triangle must add to 90°.

Tangents from a point screenshot
Tangents from a point

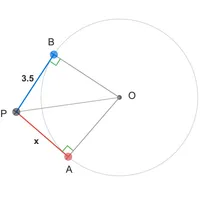
Circle Theorem: Two Tangents from a Point are Equal New!

From any point outside a circle you can draw exactly two tangents, and they are always the same length.

Move P closer or further away and both tangents change together. The two right angles and the line of symmetry through the centre show why.

Alternate segment screenshot
Alternate segment

Circle Theorem: The Alternate Segment Theorem New!

The angle between a tangent and a chord is equal to the angle in the alternate segment — the one on the other side of the chord.

Slide the point in that segment and its angle refuses to move. Drag the chord instead and both angles change together, staying equal.

The fraction wall screenshot
The fraction wall

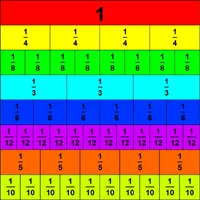
Fraction Wall

This activity can be used to explore equivalence between fractions, decimals, and percentages.

Fractions are represented by layers of bricks which can be turned on or off. It is easy to show why, for example, one half is equal to two-quarters or four-eighths.

Octagon Interior angles screenshot
Octagon Interior angles

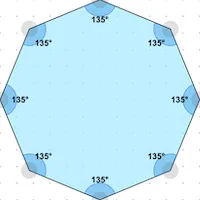
Polygon Explorer

Create and manipulate various polygons by dragging their vertices.

Explore interior and exterior angles and watch them update in real-time as you reshape the polygon. You can also lock the vertices to a circle to investigate the properties of cyclic polygons.

Rectifying the circumference screenshot
Rectifying the circumference

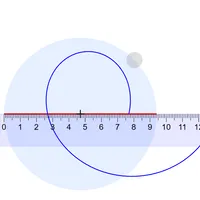
Discover π

Explore the relationship between a circle's circumference and its diameter. Drag the interactive handle to resize the circle and watch the corresponding values for the diameter and circumference update in real-time.

Use the slider to unroll the circumference into a straight line, visually demonstrating that it is always ~3.14 times longer than the diameter, and thus discovering the constant Pi (π).

Bean machine & bell curve screenshot
Bean machine & bell curve

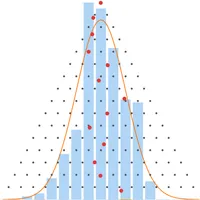
Galton Board New!

Drop balls through a triangle of pins and watch them bounce randomly left or right into the buckets below, building a bell curve before your eyes.

Reveal the path counts to uncover Pascal's triangle hidden in the board, and overlay the theoretical curve to connect probability with the binomial and normal distributions.

Rectangle Area screenshot
Rectangle Area

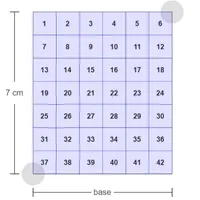
Area of a Rectangle

Explore the area of a rectangle by dragging its corners to change its base and height. Toggle a grid of unit squares to visually count the area and prove the formula: Area = base × height.

Reveal the calculation step-by-step to see how the formula is applied. You can also generate a random rectangle to test your understanding.

Parallelogram Area screenshot
Parallelogram Area

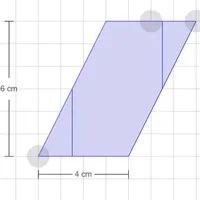
Area of a Parallelogram

Explore the area of a parallelogram to help discover that the area is the same as a rectangle with an equal base and height. Drag the vertices to manipulate the shape.

Rotate △ parts of the parallelogram to transform into a rectangle, visually proving Area = base × height. Generate random problems to find the base, height or area.

Triangle Area screenshot
Triangle Area

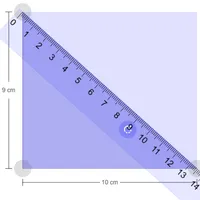
Area of a triangle

Explore how a triangle's area is exactly half that of a rectangle. Animate the triangle's two halves rotate to perfectly fill the remaining space, visually proving the formula: Area = ½ × base × height

Generate random problems and solve for the missing area, base, or height.

Trapezium Area screenshot
Trapezium Area

Area of a Trapezium

Explore the area of a trapezium to help discover that the area is the same as a rectangle with equal height and a width equal to the mean of the parallel sides. Drag the vertices to manipulate the shape.

Rotate and rearrange parts of the trapezium to transform into a rectangle, visually proving Area = ½(a + b) × height. Generate random problems to find the parallel sides, height or area.

Times Tables screenshot
Times Tables

Times Tables Arrays

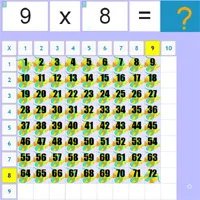
Learning the times tables is extremely important. This activity can quickly demonstrate any tables value.

The visual representation allows children to grasp very quickly that multiplication is commutative, i.e., 3x4 is the same as 4x3.

Classroom utility timer screenshot
Classroom utility timer

Classroom Timer

The classroom timer is a general-purpose countdown timer for lessons. It can be used as an effective way to get a class to focus on the task at hand.

It has two modes: the 'seconds mode' for very quick tasks of less than 60 seconds, and the 'minutes mode' for longer activities of up to an hour.

 Sierpinski like triangle screenshot
Sierpinski like triangle

Fractal Explorer

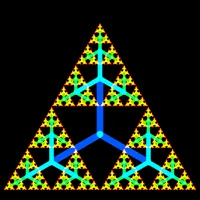
The fractal explorer shows how a very simple pattern, when repeated, can produce an incredible range of images, from organic tree-like structures to rigid geometric forms.

Fun to use and involves lots of mathematical concepts.


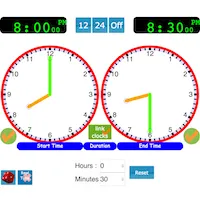
Two Clocks screenshot
Two Clocks

Two Clocks

This clock activity is great for teaching about time problems. The first clock shows the start time, while the second clock shows the end time. 

The duration between the times can be automatically calculated. Either clock or the duration can be hidden.

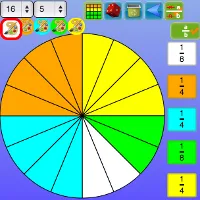
Fraction Circle or Square screenshot
Fraction Circle or Square

Percentage Fraction Decimal Grid

Divide a square or circle into a number of parts.

The slices or rectangles can be painted various colors, and these colors then represented as either decimals, fractions, or percentages.

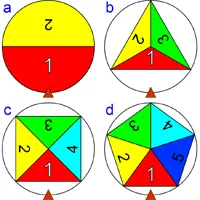
Four Spinners screenshot
Four Spinners

Random Spinners

The spinners can be used simply to generate random numbers. Or try the built-in activities. The first game requires children to use their skills to reach a target number by adding, subtracting, or multiplying the spinner values.

More advanced activities require calculation and/or algebraic substitution using the spinner values.

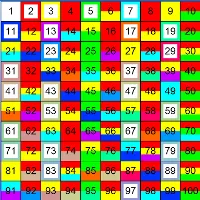
Primes up to 100 screenshot
Primes up to 100

Sieve of Eratosthenes

Named after the Greek Mathematician, this classic method of finding prime numbers is also great for teaching about factors and multiples.

The Visnos sieve allows for multi-colored squares, which helps in the identification of any number's prime factors.

A Subtraction Fact screenshot
A Subtraction Fact

Addition & Subtraction Facts

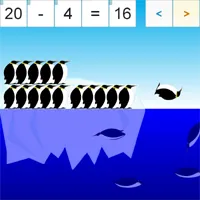
Teaches addition and subtraction facts up to twenty using animated penguins.

The penguins jump between two icebergs to show addition facts for the given total. For subtraction facts, the penguins dive off the iceberg into the water below.

A number line represents the number facts.

Percentages of two screenshot
Percentages of two

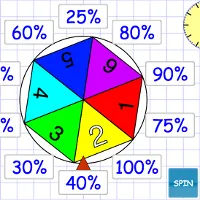
Starter: Calculate Percent, Fraction, Decimal

A spinner creates a random number. The class then has one minute to multiply the value by percentages, fractions, or decimal values.

Makes a great lesson starter to get brains active. Also provides discussion for various ways of getting the answers.

36 a Triangular Number screenshot
36 a Triangular Number

Number Explorer

Visually divide numbers and display the calculation to show the remainder, fraction, or decimal value.

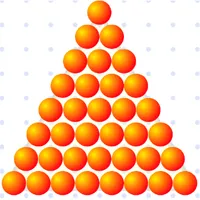
Test if a number is triangular or square. Run automated tests for divisibility, factor pairs, or prime factors.